
Detection
Votre matrice de flux ne voit pas tout : pourquoi il faut une couche comportementale
Your Flow Matrix Doesn't See Everything: Why You Need a Behavioral Layer
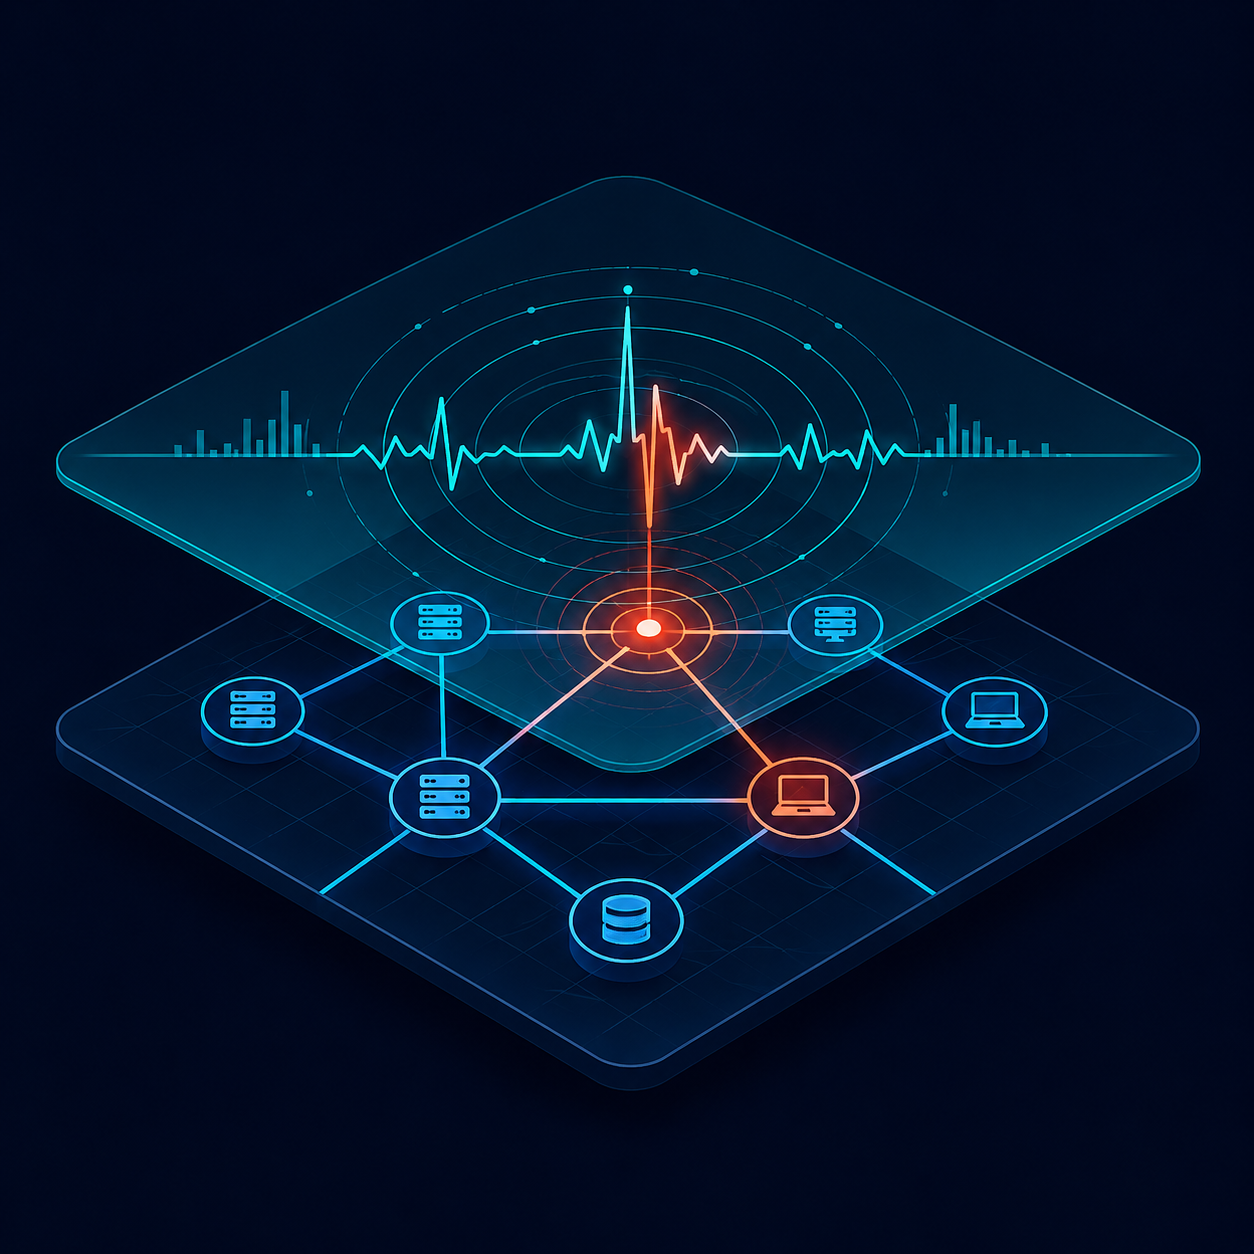
Premier article d'une série consacrée à la détection comportementale et statistique dans obserae. Au programme des prochains épisodes : statistiques robustes, saisonnalité, entropie, first-seen, détection de beaconing, de scans, d'exfiltration — et comment tout cela s'assemble en un score par machine. Aujourd'hui, on pose le problème.
obserae repose sur une idée simple et assumée : plutôt que d'apprendre magiquement ce qui est normal sur votre réseau, on vous demande de le déclarer. Vous nommez vos réseaux, vos hôtes, vos groupes et vos services dans la Cartography ; vous décrivez les communications attendues dans la Flow Matrix ; et chaque session observée est confrontée à ce modèle. Ce qui ne colle pas remonte.
Cette approche déclarative fonctionne remarquablement bien — et nous allons commencer par le redire, parce que la suite de cet article pourrait laisser croire le contraire. Mais elle a des angles morts. Trois scénarios d'attaque, tous les trois banals, la traversent sans déclencher quoi que ce soit. Cette série d'articles existe parce que nous voulons les fermer, et nous voulons le faire avec des méthodes que vous pourrez comprendre, auditer et régler — pas avec une boîte noire.
Ce que la matrice de flux fait très bien
Commençons par rendre justice au modèle. Quand vous importez votre cartographie et que vous décrivez vos flux légitimes — backends → postgres:5432, office → proxy:3128, bastion → production:ssh — vous obtenez trois choses que la plupart des NDR du marché n'offrent pas :
Un modèle exact, pas une inférence. La matrice de flux n'est pas une approximation statistique de votre architecture : c'est votre architecture. Quand une session ne matche aucune règle, ce n'est pas « anormal à 87 % » — c'est en dehors du modèle que vous avez déclaré, point. Le filtre Unmatched only de la page Sessions est probablement la vue au meilleur rapport signal/bruit de tout le produit : chaque ligne est une conversation que personne n'a prévue.
Une boucle d'amélioration continue. Le trafic non couvert vous force à trancher : légitime → on l'ajoute à la matrice ; suspect → on investigue. Semaine après semaine, la matrice converge vers une description fidèle et vivante de votre réseau. C'est un baseline, au sens propre — mais un baseline que vous avez validé ligne par ligne, pas un baseline appris pendant que, peut-être, un attaquant était déjà là.
Des violations de politique explicites. Une workstation qui parle directement à un serveur de la zone data, un flux qui contourne le bastion, du PostgreSQL hors du réseau data : autant de détections qui ne demandent aucune statistique, juste la confrontation du trafic à l'intention.
Si vous n'exploitez pas encore ce mécanisme à fond, arrêtez ici votre lecture et allez passer une heure sur Unmatched only. Le reste de cette série peut attendre ; cette heure-là, non.
Trois attaques que votre matrice regarde passer
Le problème, c'est que la matrice répond à une seule question : ce flux est-il autorisé ? Or les attaques matures ne s'exécutent pas dans des flux interdits. Elles s'exécutent dans vos flux autorisés. Voici trois scénarios — trois classiques, rien d'exotique — vus à travers les yeux de la matrice.
Scénario 1 : le beacon C2 sur le port 443
Une workstation est compromise par un implant — hameçonnage, pièce jointe, peu importe. L'implant fait ce que font tous les implants modernes : il se connecte périodiquement à son serveur de commande et contrôle, en HTTPS, pour demander ses instructions.
Côté obserae, voici ce que ça donne :
client 10.10.42.31:52144  ->  server 203.0.113.50:443  TCP
duration 2s, 1.2 KB client->server, 0.9 KB server->client
matched rule: office-to-internet-https
Session courte, volume minuscule, port 443, règle matchée. Cette session est indiscernable d'une visite de site web — et votre matrice contient forcément une règle qui autorise vos postes à sortir en HTTPS, sinon plus personne ne travaille. L'implant se reconnectera dans cinq minutes. Puis dans cinq minutes. Puis dans cinq minutes. Pendant des semaines.
Ce que la matrice ne voit pas : ce n'est pas une session qui est suspecte, c'est la série. Un humain qui navigue produit des connexions irrégulières, en rafales, aux horaires de bureau. Un implant produit un métronome. La différence n'est visible que si on regarde le rythme — et le rythme, ça se mesure.
Scénario 2 : l'exfiltration par le flux légitime
Votre serveur de base de données a le droit de parler au serveur de sauvegarde — évidemment, c'est comme ça que les backups fonctionnent. La règle existe, elle est propre, elle est même taguée critical.
Un soir, un attaquant qui a pris pied sur le serveur de backup s'en sert comme point de collecte : il aspire la base, en réutilisant exactement ce canal.
client 10.0.10.12:48812  ->  server 10.0.20.5:9102  TCP
duration 41m, 380 GB client->server
matched rule: databases-to-backup
380 gigaoctets là où le backup incrémental quotidien en fait 4. La session est parfaitement conforme : bons endpoints, bon port, bonne direction. La matrice n'a rien à redire — elle ne contraint ni le volume, ni l'horaire, ni la fréquence. Ce que personne n'a déclaré, parce que ce n'est pas déclarable dans un modèle de connectivité, c'est l'ordre de grandeur habituel de ce flux.
Scénario 3 : le compte compromis qui fait tout comme il faut
Les identifiants d'un administrateur fuitent. L'attaquant se connecte au bastion, puis du bastion vers la production, en SSH. C'est-à-dire : il emprunte très exactement le chemin que votre architecture prescrit, celui que vous avez soigneusement codifié dans la matrice.
client 10.0.5.2:60318  ->  server 10.0.30.14:22  TCP
duration 2h 12m
matched rule: bastion-to-prod-ssh
Un samedi, à 3h17 du matin. Votre équipe d'admins travaille en semaine, entre 8h et 19h, et tout l'historique de sessions le prouve. Mais la matrice ne connaît pas les horaires. Pour elle, une session SSH bastion→prod est légitime le mardi à 10h comme le samedi à 3h — c'est la même règle qui matche.
Autorisé n'est pas normal
Ces trois scénarios ont un point commun : l'attaquant ne viole pas votre politique de connectivité, il en abuse. Et il peut le faire parce qu'une session a plus de dimensions que celles qu'une règle de connectivité contraint.
Une règle de la Flow Matrix fixe qui parle à qui, sur quel service. Elle laisse libres au moins quatre dimensions :
- le volume — combien d'octets, dans quelle direction (scénario 2) ;
- le rythme — à quelle fréquence, avec quelle régularité (scénario 1) ;
- l'horaire — à quel moment de la journée, de la semaine (scénario 3) ;
- la dispersion — vers combien de destinations distinctes, sur combien de ports (le poste qui se met à contacter cinquante machines internes en dix minutes : nous y reviendrons dans l'article sur les scans et le mouvement latéral).
C'est précisément sur ces quatre dimensions que se joue la détection comportementale. Non pas à la place de la matrice, mais après elle : la matrice élimine l'inattendu structurel ; le comportemental surveille ce qui reste — c'est-à-dire l'essentiel de votre trafic — sur les dimensions qu'elle ne contraint pas.
Autorisé ≠ normal. Toute la série tient dans ce signe.
Deux écoles chez les NDR
Comment le marché s'attaque-t-il à ce problème ? En simplifiant à peine, deux philosophies se partagent le terrain.
Apprendre le normal. On construit, pour chaque machine, un profil de son comportement habituel — à qui elle parle, quand, combien — et on alerte sur les déviations. C'est l'école du baseline : elle excelle à détecter ce qu'on n'avait pas prévu de chercher, y compris des attaques inédites. Son talon d'Achille : définir « normal » sur un réseau vivant est difficile, et tout ce qui change légitimement (nouveau service, migration, pic saisonnier) ressemble d'abord à une anomalie. Mal réglée, cette approche produit du bruit ; et le bruit, en détection, tue.
Reconnaître les comportements d'attaquant. À l'inverse, on ne modélise pas votre réseau : on modélise l'adversaire. Un beacon C2 a une signature statistique (régularité temporelle, tailles constantes) qui ne dépend pas de votre environnement. Un scan a la sienne. Une exfiltration aussi. On construit un détecteur spécialisé par comportement, chacun avec ses métriques propres. Avantage : peu de faux positifs, des verdicts qui portent un nom (« beaconing », pas « anomalie »). Limite : on ne détecte que ce qu'on a explicitement modélisé.
Les bons NDR font les deux, et c'est notre plan pour obserae. Le premier volet de cette série couvre les fondations « baseline » — les outils statistiques pour mesurer le normal et repérer l'écart. Le second volet construit, par-dessus, des détecteurs de comportements d'attaquant nommés. Les deux volets convergent à la fin vers une question de synthèse : comment agréger tous ces signaux par machine, pour que votre file d'alertes reste triable par un humain.
Pourquoi nous commençons par la statistique, pas par le machine learning
Un mot sur la méthode, parce que le sujet est saturé de marketing. La quasi-totalité des NDR du marché se présentent comme « pilotés par l'IA ». Sous le capot, une grande partie des détections qui fonctionnent vraiment — celles qui tiennent en production, avec un taux de faux positifs supportable — sont de la statistique robuste bien appliquée : médianes, déviations absolues, scores de régularité, comptages de nouveauté. Ce n'est pas une critique ; c'est une bonne nouvelle. Cela veut dire que l'essentiel de la valeur est atteignable avec des méthodes :
Explicables. Quand obserae vous alertera, l'alerte dira « ce flux fait 14 fois la médiane des trente derniers mardis à cette heure », ou « score de régularité 0,93 sur 240 connexions ». Pas « le modèle a produit 0,87 ». Vous pourrez vérifier le calcul, contester le seuil, comprendre le faux positif. Pour un produit qui revendique de fournir des preuves auditables — c'est notre positionnement NIS2/DORA/SOC 2 — l'explicabilité n'est pas un luxe, c'est le contrat.
Locales et frugales. obserae tourne chez vous, sur une machine, sans envoyer vos données de trafic dans un cloud. Ça restera vrai. Les méthodes que nous retenons doivent tenir ce cadre : calcul incrémental, empreinte mémoire bornée, pas de GPU, pas d'entraînement sur des datasets externes. Vous verrez au fil de la série que c'est tout à fait tenable — et que quelques structures de données astucieuses font des merveilles.
Réglables sans doctorat. Un seuil exprimé en « écarts robustes à la médiane » se règle. Un réseau de neurones se subit.
Le machine learning plus lourd n'est pas exclu à jamais — il y a des endroits où il apportera quelque chose, et nous en parlerons honnêtement le moment venu. Mais il viendra en dernier, comme un détecteur parmi d'autres, jamais comme un oracle.
Le programme de la série
Voici où nous allons, article par article :
Volet 1 — Les fondations statistiques. Médiane, MAD et z-score robuste : détecter les pics de volume sans se faire piéger par ses propres données. Puis la saisonnalité : pourquoi 3h du matin ne se juge pas comme 14h. L'entropie de Shannon : une formule, trois détections. Le first-seen : la nouveauté comme signal — le détecteur le plus rentable de tous, et il est déjà en partie dans obserae. Enfin, la traduction produit : une condition d'alerte Anomaly aux côtés de Presence, Threshold, First seen et Heartbeat, et de nouvelles fonctions statistiques dans NFQL.
Volet 2 — Les détecteurs comportementaux. Le beaconing C2 et l'algorithme qui le débusque (celui de l'outil open source RITA — nous le déroulerons calcul par calcul). Les scans et la reconnaissance, que le sessionizer d'obserae matérialise déjà via les sessions sans réponse. Les profils d'entités et la comparaison aux pairs — où votre cartographie devient un avantage décisif : comparer une workstation aux autres workstations est trivial quand les rôles sont déclarés. L'exfiltration et le data hoarding. Le contexte externe (ASN, GeoIP, Tor, cloud) transformé de badge décoratif en feature de détection. Et pour finir, le scoring par accumulation d'évidences : comment trois signaux faibles sur la même machine deviennent une alerte forte — et comment votre file de triage arrête de déborder.
Chaque article suivra le même contrat : l'algorithme expliqué pour de vrai, ce qu'il détecte (et ce qu'il rate — nous tiendrons la colonne « limites » avec autant de soin que la colonne « promesses »), et au moins une requête NFQL que vous pourrez exécuter sur vos propres sessions, aujourd'hui, dans la page Investigation.
En attendant le prochain épisode
Deux devoirs à la maison, si le sujet vous parle.
Le premier : ouvrez la page Sessions, activez Unmatched only sur les dernières 24 heures, et regardez. C'est la version déclarative de tout ce que cette série va construire, et c'est disponible maintenant.
Le second : lancez cette requête dans Investigation, qui donne un premier aperçu de la dimension « volume » de vos flux sortants — le terrain de jeu du prochain article :
FROM sessions
  | LAST 86400
  | WHERE server_ip == "internet4"
  | STATS out = SUM(client_to_server_bytes), sessions = COUNT(*) BY client_ip
  | SORT out DESC
  | LIMIT 20
Vos vingt plus gros émetteurs vers l'internet public, sur la dernière journée. La question qui suit — « et c'est normal, ça ? » — est exactement celle à laquelle le prochain article apprendra à répondre avec autre chose que l'intuition : médiane, MAD, et un z-score qui ne se laisse pas contaminer par les anomalies qu'il est censé détecter.
À très vite.
obserae est un NDR self-hosted construit sur NetFlow et IPFIX : vos données de trafic restent chez vous. Installez-le avec Docker et suivez le quickstart — dix minutes de votre propre trafic suffisent pour voir les premières conversations inattendues.
First article in a series on behavioral and statistical detection in obserae. Coming up in future installments: robust statistics, seasonality, entropy, first-seen, and the detection of beaconing, scans, and exfiltration — and how it all comes together into a per-host score. Today, we frame the problem.
obserae rests on a simple, deliberate idea: rather than magically learning what is normal on your network, we ask you to declare it. You name your networks, hosts, groups, and services in the Cartography; you describe the expected communications in the Flow Matrix; and every observed session is checked against that model. Whatever doesn't fit bubbles up.
This declarative approach works remarkably well — and we'll start by saying so, because the rest of this article might suggest otherwise. But it has blind spots. Three attack scenarios, all three mundane, pass straight through it without triggering anything. This series exists because we want to close them, and we want to do it with methods you can understand, audit, and tune — not with a black box.
What the Flow Matrix Does Very Well
Let's start by giving the model its due. When you import your cartography and describe your legitimate flows — backends → postgres:5432, office → proxy:3128, bastion → production:ssh — you get three things most NDRs on the market don't offer:
An exact model, not an inference. The flow matrix isn't a statistical approximation of your architecture: it is your architecture. When a session matches no rule, it isn't "87% abnormal" — it is outside the model you declared, full stop. The Unmatched only filter on the Sessions page is probably the best signal-to-noise view in the whole product: every row is a conversation nobody planned for.
A continuous improvement loop. Uncovered traffic forces you to decide: legitimate → add it to the matrix; suspicious → investigate. Week after week, the matrix converges toward a faithful and living description of your network. It's a baseline in the truest sense — but a baseline you validated line by line, not one learned while, perhaps, an attacker was already inside.
Explicit policy violations. A workstation talking directly to a server in the data zone, a flow bypassing the bastion, PostgreSQL outside the data network: all detections that require no statistics, just traffic checked against intent.
If you're not yet using this mechanism to its full extent, stop reading here and go spend an hour on Unmatched only. The rest of this series can wait; that hour can't.
Three Attacks Your Matrix Watches Go By
The problem is that the matrix answers a single question: is this flow allowed? But mature attacks don't run inside forbidden flows. They run inside your allowed flows. Here are three scenarios — three classics, nothing exotic — seen through the matrix's eyes.
Scenario 1: The C2 Beacon on Port 443
A workstation is compromised by an implant — phishing, an attachment, whatever. The implant does what every modern implant does: it connects periodically to its command-and-control server, over HTTPS, to fetch its instructions.
On the obserae side, here's what that looks like:
client 10.10.42.31:52144  ->  server 203.0.113.50:443  TCP
duration 2s, 1.2 KB client->server, 0.9 KB server->client
matched rule: office-to-internet-https
Short session, tiny volume, port 443, rule matched. This session is indistinguishable from a website visit — and your matrix necessarily contains a rule allowing your workstations to reach the internet over HTTPS, otherwise nobody gets any work done. The implant will reconnect in five minutes. Then in five minutes. Then in five minutes. For weeks.
What the matrix doesn't see: it isn't one session that's suspicious, it's the series. A human browsing produces irregular connections, in bursts, during office hours. An implant produces a metronome. The difference is only visible if you look at the rhythm — and rhythm can be measured.
Scenario 2: Exfiltration Through a Legitimate Flow
Your database server is allowed to talk to the backup server — obviously, that's how backups work. The rule exists, it's clean, it's even tagged critical.
One evening, an attacker who has gained a foothold on the backup server uses it as a collection point: they siphon off the database, reusing exactly that channel.
client 10.0.10.12:48812  ->  server 10.0.20.5:9102  TCP
duration 41m, 380 GB client->server
matched rule: databases-to-backup
380 gigabytes where the daily incremental backup moves 4. The session is perfectly compliant: right endpoints, right port, right direction. The matrix has nothing to object to — it constrains neither volume, nor timing, nor frequency. What nobody declared, because it isn't declarable in a connectivity model, is the usual order of magnitude of this flow.
Scenario 3: The Compromised Account That Does Everything by the Book
An administrator's credentials leak. The attacker connects to the bastion, then from the bastion to production, over SSH. In other words: they follow exactly the path your architecture prescribes, the one you carefully codified in the matrix.
client 10.0.5.2:60318  ->  server 10.0.30.14:22  TCP
duration 2h 12m
matched rule: bastion-to-prod-ssh
On a Saturday, at 3:17 a.m. Your admin team works weekdays, between 8 a.m. and 7 p.m., and the entire session history proves it. But the matrix knows nothing about schedules. To it, a bastion→prod SSH session is as legitimate on Tuesday at 10 a.m. as on Saturday at 3 a.m. — it's the same rule that matches.
Allowed Isn't Normal
These three scenarios share one trait: the attacker doesn't violate your connectivity policy, they abuse it. And they can do so because a session has more dimensions than the ones a connectivity rule constrains.
A Flow Matrix rule fixes who talks to whom, over which service. It leaves at least four dimensions free:
- volume — how many bytes, in which direction (scenario 2);
- rhythm — how often, how regularly (scenario 1);
- timing — what time of day, of the week (scenario 3);
- spread — toward how many distinct destinations, over how many ports (the host that suddenly starts contacting fifty internal machines in ten minutes: we'll come back to this in the article on scans and lateral movement).
It's precisely on these four dimensions that behavioral detection plays out. Not instead of the matrix, but after it: the matrix eliminates the structurally unexpected; the behavioral layer watches what remains — that is, the bulk of your traffic — along the dimensions the matrix doesn't constrain.
Allowed ≠ normal. The whole series fits inside that sign.
Two Schools of NDR
How does the market tackle this problem? At the risk of barely oversimplifying, two philosophies split the field.
Learning what's normal. You build, for each machine, a profile of its usual behavior — who it talks to, when, how much — and you alert on deviations. This is the baseline school: it excels at detecting what you weren't looking for, including novel attacks. Its Achilles' heel: defining "normal" on a living network is hard, and everything that legitimately changes (a new service, a migration, a seasonal spike) looks like an anomaly at first. Poorly tuned, this approach produces noise; and noise, in detection, kills.
Recognizing attacker behaviors. Conversely, you don't model your network: you model the adversary. A C2 beacon has a statistical signature (temporal regularity, constant sizes) that doesn't depend on your environment. A scan has its own. So does exfiltration. You build one specialized detector per behavior, each with its own metrics. Upside: few false positives, verdicts that carry a name ("beaconing," not "anomaly"). Limitation: you only detect what you've explicitly modeled.
Good NDRs do both, and that's our plan for obserae. The first part of this series covers the "baseline" foundations — the statistical tools to measure normal and spot the deviation. The second part builds, on top of that, named attacker-behavior detectors. Both parts converge at the end on a synthesis question: how to aggregate all these signals per machine, so your alert queue stays triageable by a human.
Why We Start With Statistics, Not Machine Learning
A word on method, because the topic is saturated with marketing. Nearly every NDR on the market presents itself as "AI-driven." Under the hood, a large share of the detections that actually work — the ones that hold up in production, with a bearable false-positive rate — are well-applied robust statistics: medians, absolute deviations, regularity scores, novelty counts. This isn't a criticism; it's good news. It means most of the value is reachable with methods that are:
Explainable. When obserae alerts you, the alert will say "this flow is 14 times the median of the last thirty Tuesdays at this hour," or "regularity score 0.93 over 240 connections." Not "the model produced 0.87." You'll be able to check the math, challenge the threshold, understand the false positive. For a product that claims to provide auditable evidence — that's our NIS2/DORA/SOC 2 positioning — explainability isn't a luxury, it's the contract.
Local and frugal. obserae runs on your premises, on a single machine, without sending your traffic data to a cloud. That will stay true. The methods we choose have to hold to that constraint: incremental computation, bounded memory footprint, no GPU, no training on external datasets. You'll see throughout the series that this is entirely doable — and that a few clever data structures work wonders.
Tunable without a PhD. A threshold expressed in "robust deviations from the median" can be tuned. A neural network can only be endured.
Heavier machine learning isn't ruled out forever — there are places where it will add something, and we'll talk about it honestly when the time comes. But it will come last, as one detector among others, never as an oracle.
The Series Roadmap
Here's where we're headed, article by article:
Part 1 — The statistical foundations. Median, MAD, and the robust z-score: detecting volume spikes without being fooled by your own data. Then seasonality: why 3 a.m. isn't judged like 2 p.m. Shannon entropy: one formula, three detections. First-seen: novelty as a signal — the most cost-effective detector of them all, and it's already partly in obserae. Finally, the product translation: an Anomaly alert condition alongside Presence, Threshold, First seen, and Heartbeat, plus new statistical functions in NFQL.
Part 2 — The behavioral detectors. C2 beaconing and the algorithm that flushes it out (the one from the open-source tool RITA — we'll walk through it calculation by calculation). Scans and reconnaissance, which obserae's sessionizer already materializes through unanswered sessions. Entity profiles and peer comparison — where your cartography becomes a decisive advantage: comparing a workstation to the other workstations is trivial when roles are declared. Exfiltration and data hoarding. External context (ASN, GeoIP, Tor, cloud) turned from a decorative badge into a detection feature. And finally, scoring by evidence accumulation: how three weak signals on the same machine become one strong alert — and how your triage queue stops overflowing.
Every article will follow the same contract: the algorithm explained for real, what it detects (and what it misses — we'll keep the "limitations" column with as much care as the "promises" column), and at least one NFQL query you can run on your own sessions, today, in the Investigation page.
Until the Next Episode
Two pieces of homework, if the topic speaks to you.
The first: open the Sessions page, enable Unmatched only over the last 24 hours, and look. It's the declarative version of everything this series will build, and it's available now.
The second: run this query in Investigation, which gives a first glimpse of the "volume" dimension of your outbound flows — the playground of the next article:
FROM sessions
  | LAST 86400
  | WHERE server_ip == "internet4"
  | STATS out = SUM(client_to_server_bytes), sessions = COUNT(*) BY client_ip
  | SORT out DESC
  | LIMIT 20
Your twenty biggest emitters toward the public internet, over the last day. The question that follows — "and is that normal?" — is exactly the one the next article will teach you to answer with something other than intuition: median, MAD, and a z-score that won't let itself be contaminated by the very anomalies it's meant to detect.
See you soon.
obserae is a self-hosted NDR built on NetFlow and IPFIX: your traffic data stays with you. Install it with Docker and follow the quickstart — ten minutes of your own traffic is enough to see the first unexpected conversations.
See what your flow matrix misses
obserae is a self-hosted NDR that turns your NetFlow and IPFIX into auditable evidence — deployed in ten minutes, your data never leaves your infrastructure.